


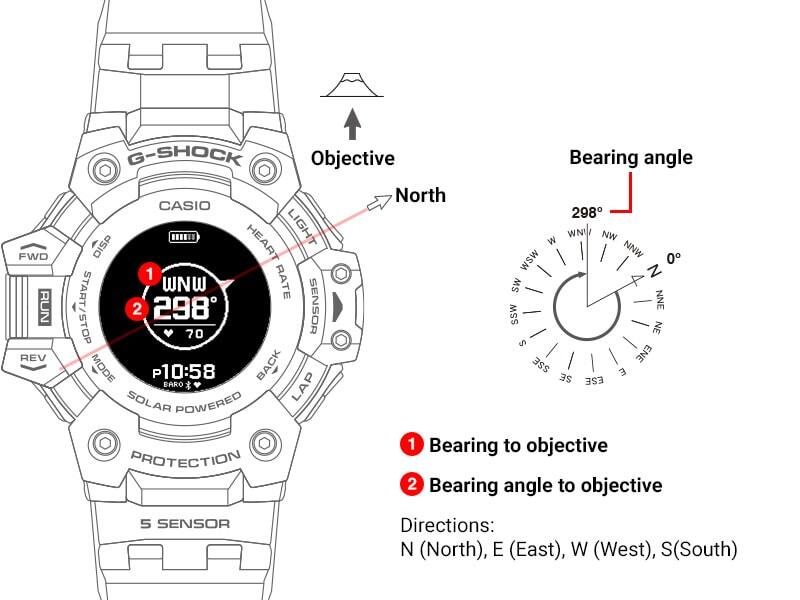
Compass bearing
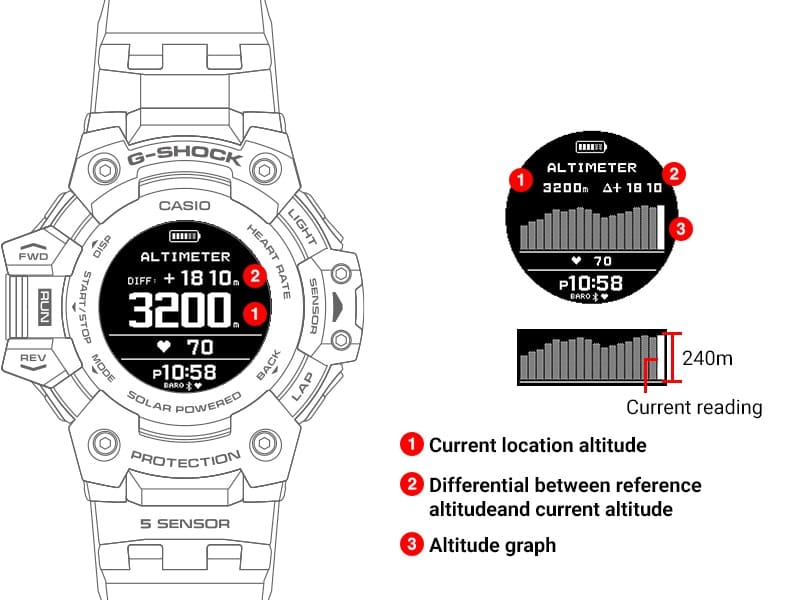
Altitude
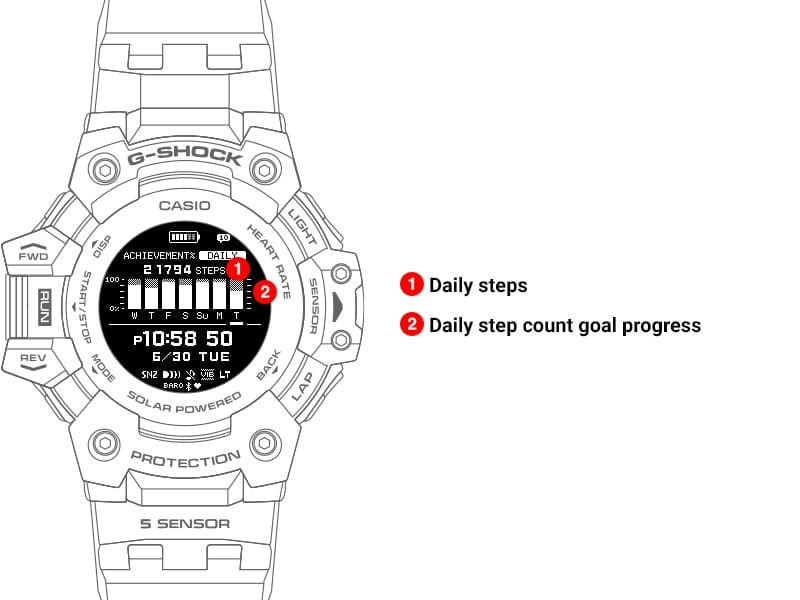
Acceleration Sensor (step counter)
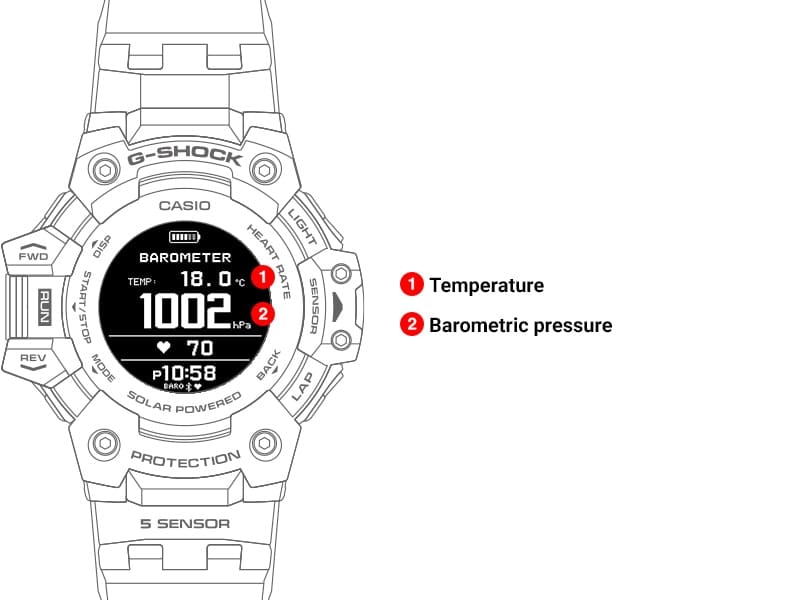
Barometric Pressure / Temperature
Value Screen
Barometric Pressure Graph Screen
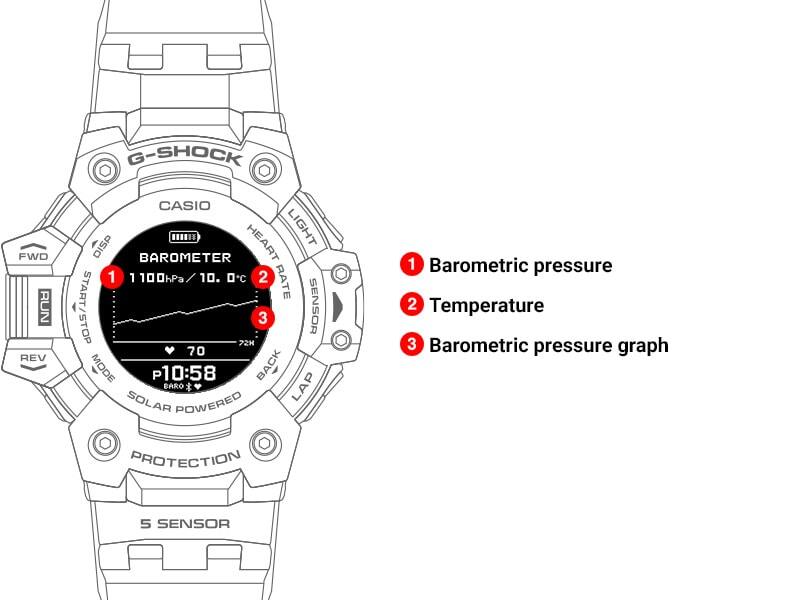
The graph shows barometric readings taken every two hours. You can use the graph to view changes in barometric pressure over the past 72 hours, which can be used to predict upcoming weather.
A trend like this |
Means this |
| Rising barometric pressure, which indicates that upcoming weather probably will be fair. | |
| Falling barometric pressure, which indicates that upcoming weather probably will be bad. |